Web Check
Web Check is available in Pro builds. Free termorq-cli binaries do not include the termorq-cli web-check command.
Web Check runs saved API endpoints and MCP tools from a foreground termorq-cli process. Its local browser interface manages checks and displays SQLite-backed history. The header labels the build edition as FREE or PRO. Closing the browser keeps monitoring running. Ctrl+C or computer sleep interrupts it.
On Pro builds, use the Windows notification-area menu, the macOS menu-bar menu, or the macOS Dock menu to start or stop Web Check and show its output. The Show Web Check output option includes the local URL and pairing code. Windows Pro NSIS .exe and Microsoft Store MSIX packages include the matching termorq-cli.exe; macOS and other builds need termorq-cli beside the app or on PATH for Start Web Check to work. If the CLI is missing, the menu still appears and reports that when selected.
The sidebar shows the data folder used for Web Check history and the monitoring source. Select Copy beside either value to copy it.
Build and run
From the repository checkout, build browser assets before the CLI:
AI_TERMINAL_EDITION=pro pnpm build:web-check
AI_TERMINAL_EDITION=pro cargo build --manifest-path src-tauri/Cargo.toml --bin termorq-cli
src-tauri/target/debug/termorq-cli web-check --workspace ~/source/acme-apis --env Staging
Use your saved workspace and environment. Omit source options to use the local app data, or pass --data-dir /absolute/path/to/app-data. Workspace and data-dir options are mutually exclusive. Local sources do not support --env.
The CLI prints a URL on 127.0.0.1, the containing database folder, full database path and private pairing.txt path. Open that exact URL, read the pairing file locally and paste its code into Pair this browser. Codes never appear in URLs or CLI output; when the runner starts from the tray, Show Web Check output displays the code in a local dialog. Restart rotates credentials. Pairing a second browser replaces the first session.
SQLite is bundled; no database service is needed. Frontend assets are embedded in the binary. Published installers need a release containing this feature; pnpm dev does not run Web Check.
Add and manage a check
On Checks, choose Add check. Select a saved API endpoint or expand Discover MCP tools to contact a saved server and choose a tool. Set frequency, timeout, expected HTTP status or result assertions, optional parameters and a failure threshold.
Intervals range from 5 seconds to 24 hours. Timeout is 1–240 seconds and must be shorter than the interval; it includes authentication and session setup. The editor displays projected daily calls.
Path/query parameter overrides change URL parameters only. To change a POST, PUT or PATCH JSON object body, enter fields in JSON body field overrides:
{
  "message": "Hi from Termorq Web Check"
}
This replaces the saved message and preserves other fields, such as the recipient. Nested values are replaced in full; null sends null. Leave {} to use the saved body. Non-object bodies, other methods and GraphQL are unsupported for body field overrides. Existing checks keep their URL overrides until edited. Move body fields from the old parameters box into the body override box, review and save. The saved endpoint in the terminal stays unchanged.
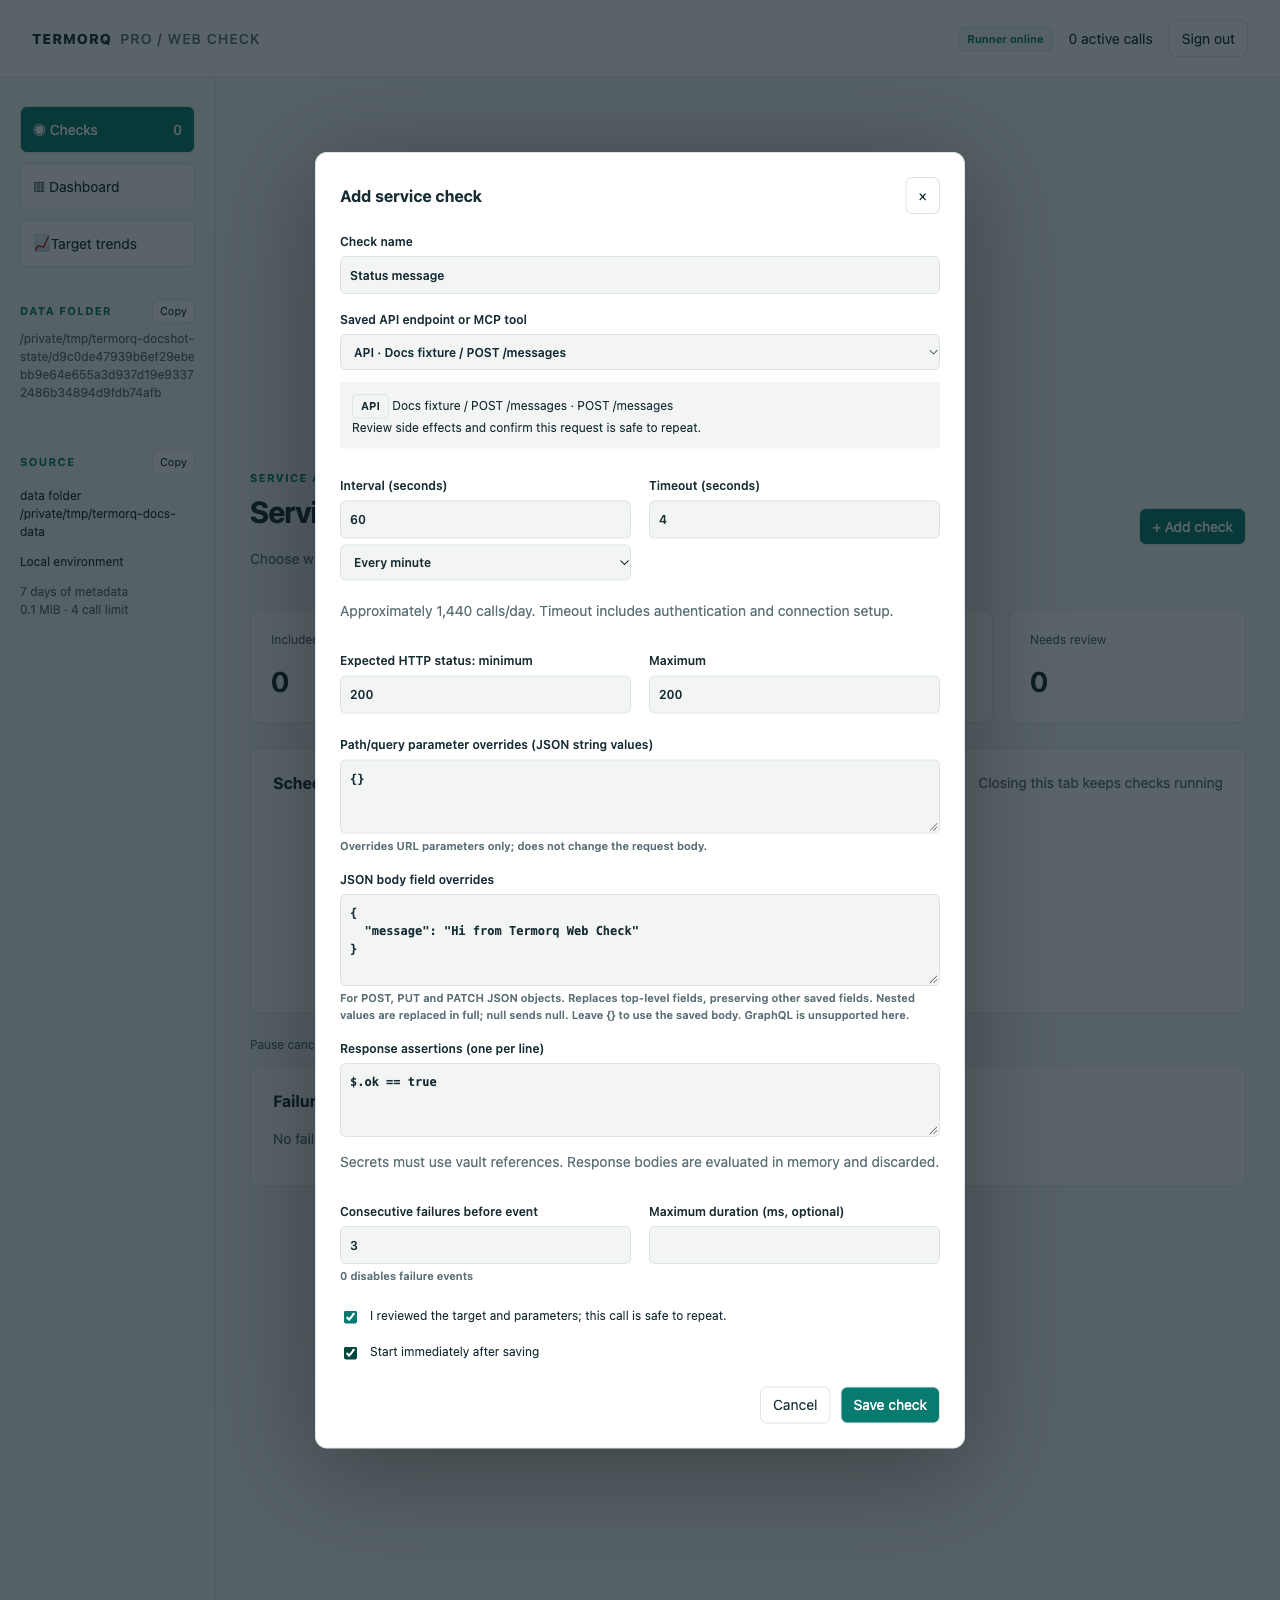
Review the request’s effects and confirm that it is safe to repeat. A new check starts paused unless you select Start immediately after saving. Use Test once, inspect History, then Start. Manual tests appear in history but do not affect scheduled metrics or alerts.
Pause stops future scheduling and requests cancellation. Already processed remote operations cannot be undone. Edit creates a reviewed revision. Remove stops inclusion, retains history for seven days and leaves the saved target intact. Underlying target or schema changes block a check until reviewed again.
Use keychain/environment/vault credentials through the existing workflow. Sensitive argument literals are rejected; use akv://... or op://... references. Destructive MCP tools are rejected. Read-only annotations still require review. Tool arguments must match the schema; external schema references are unsupported.
Read the dashboard
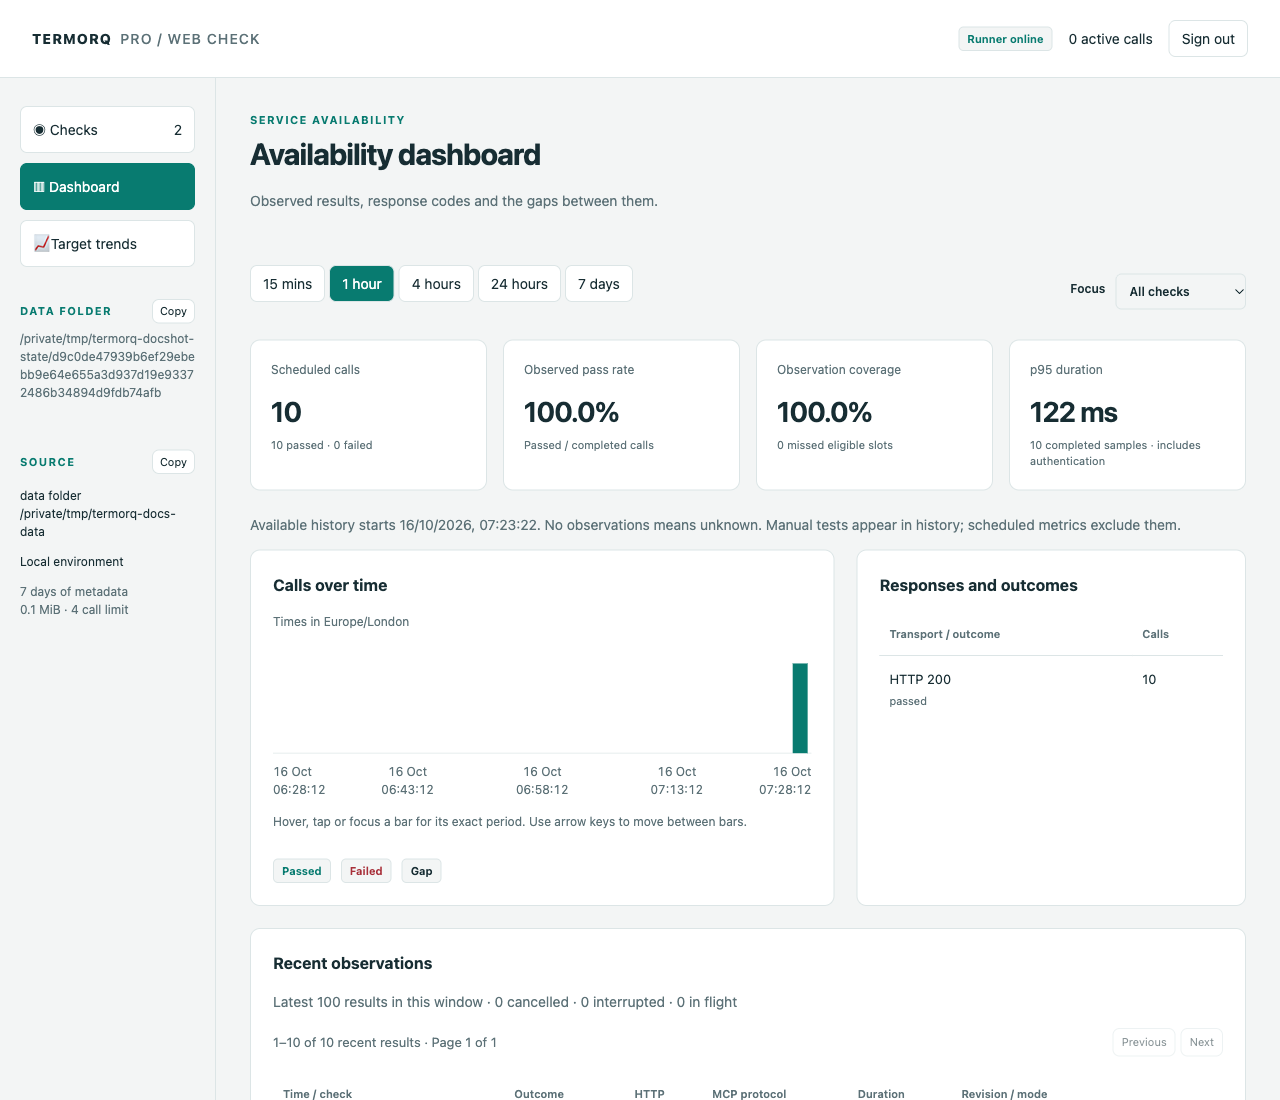
Choose 15 minutes, 1 hour, 4 hours, 24 hours or 7 days. Focus selects a check, including one removed from monitoring. All cards, chart buckets and breakdowns use the same window. Recent history pages the latest 100 records, 20 per page, with the original revision and whether each call was scheduled or manual. Use Previous and Next to browse; changing the window or Focus returns to page one. The list refreshes with the dashboard. Details opens the reviewed rules and parameters used by that execution.
The histogram labels dates and times in your browser timezone. Hover, tap or focus a bar to read its exact period and outcomes. Arrow keys move between bars. Phone layouts show fewer date/time labels to keep them readable.
- Scheduled calls counts logical executions, not token requests or MCP handshakes.
- Observed pass rate is passed divided by completed calls. No observations means Unknown.
- Observation coverage includes missed eligible slots from capacity limits, sleep, downtime and Retry-After backoff. Intentional pauses are excluded.
- p95 duration is the exact nearest-rank percentile of completed scheduled calls, including authentication and setup. The sample count is displayed.
- HTTP status, protocol error and tool failure remain distinct. HTTP 200 can contain an MCP failure; stdio has no HTTP status.
Response bodies are evaluated in memory and discarded. History contains sanitized metadata, never raw responses, credentials or protocol error messages. Old observations are Stale. A selected seven-day window does not imply seven days of data exist: available-history start is shown.
Failure and recovery events appear locally after the configured consecutive-failure threshold and the next observed scheduled pass. Acknowledge them in the interface. Pause, cancellation and gaps do not fabricate recovery. External notifications are not included.
Compare targets over time
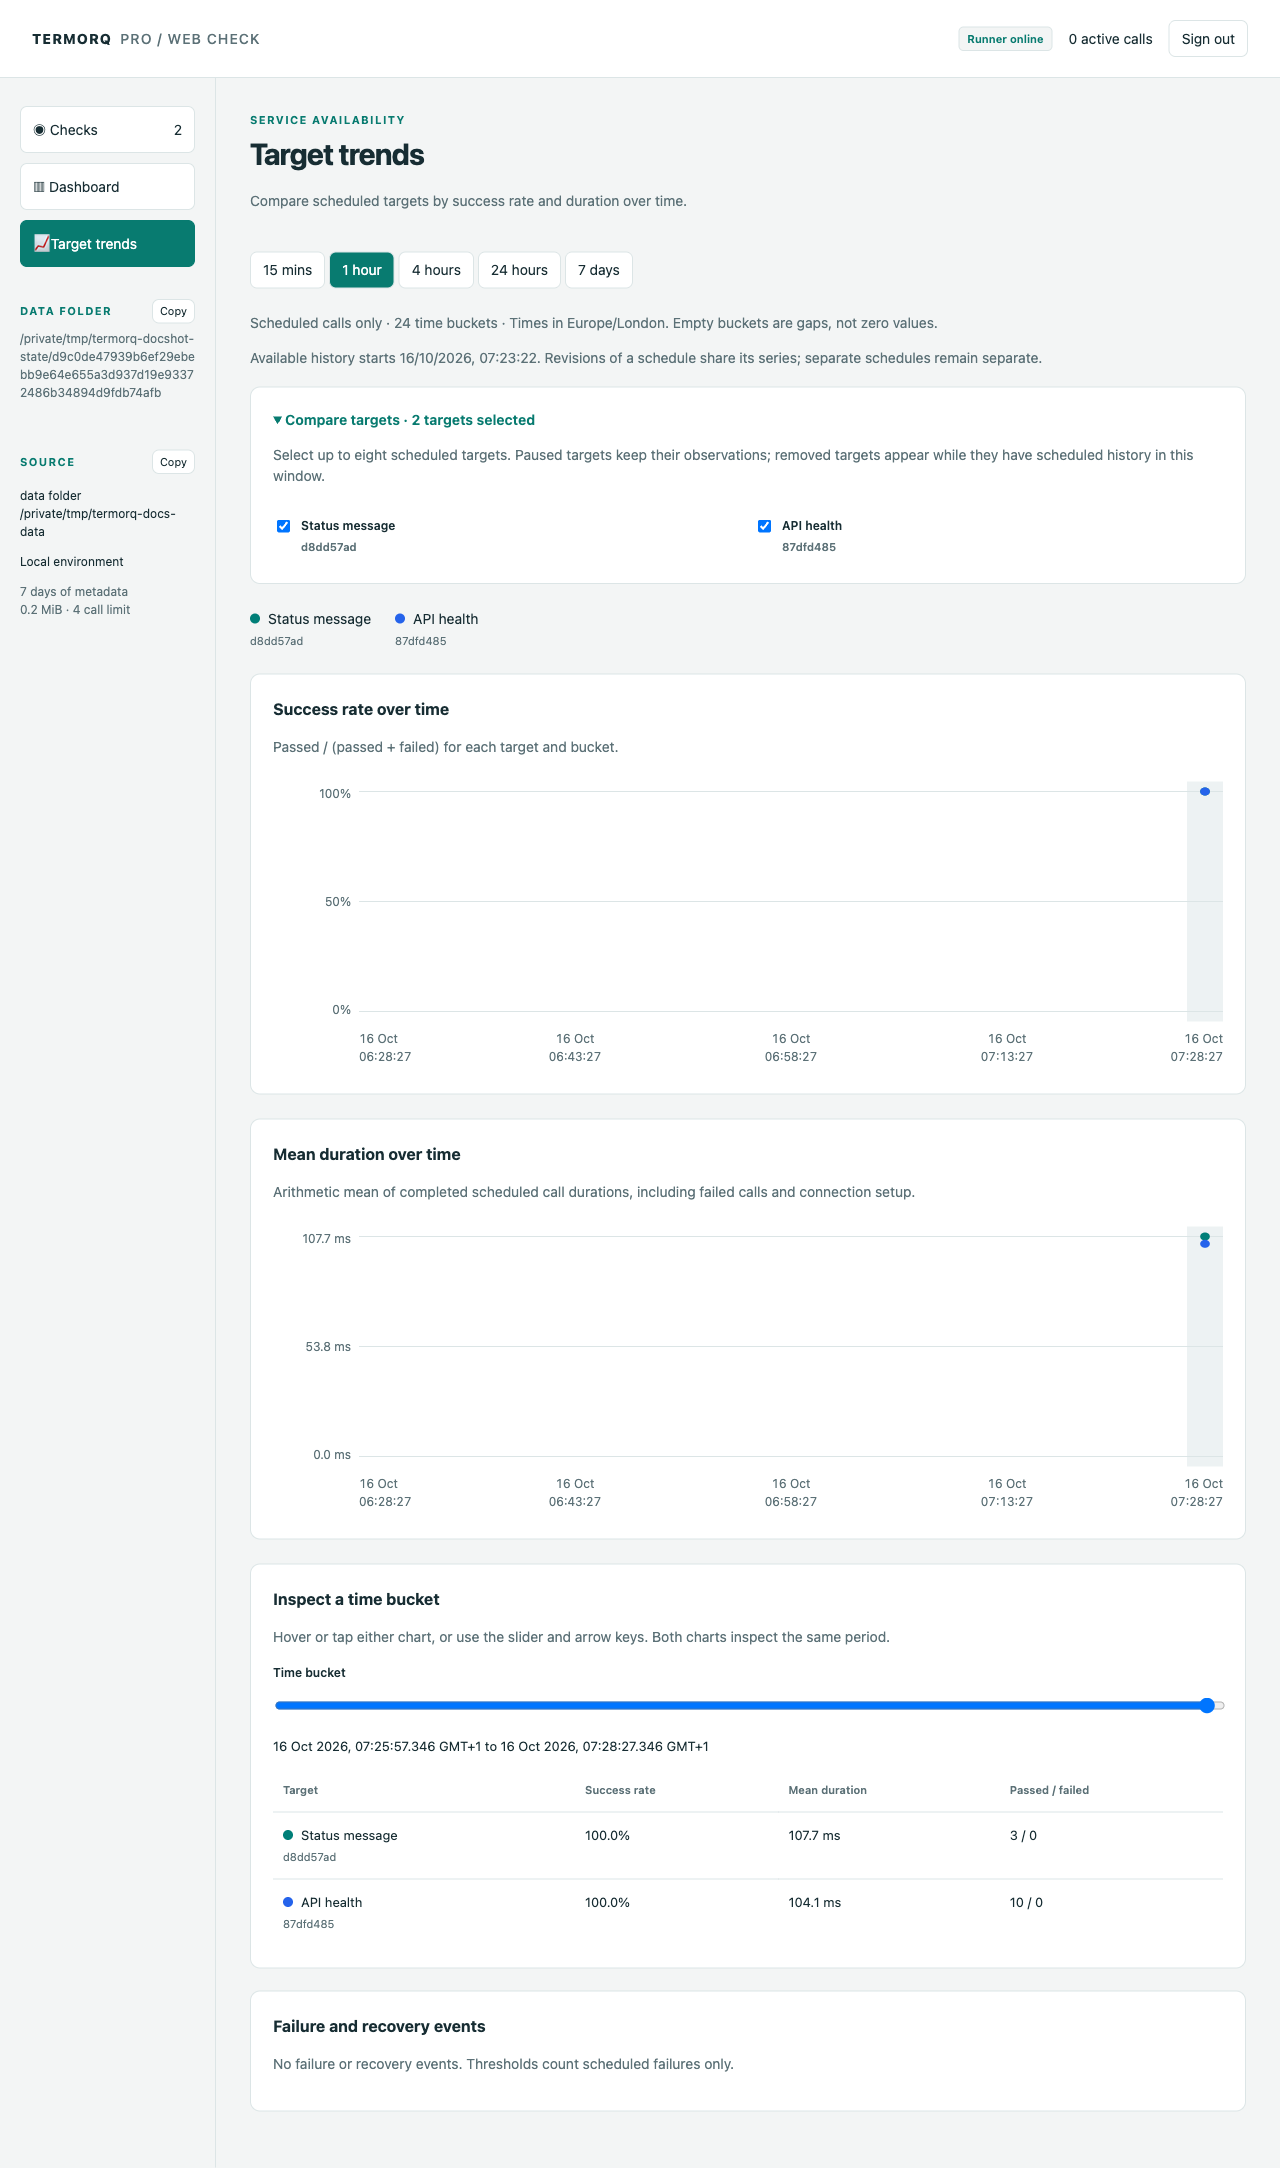
Open Target trends and select up to eight targets. Both charts share the history window, 24 time buckets and target colours. Success rate over time shows passed divided by passed plus failed, as a percentage. Mean duration over time shows the arithmetic mean duration of completed scheduled calls in milliseconds, including failed calls and connection setup.
Hover or tap either chart to inspect a period. The Time bucket slider supports arrow, Home and End keys. The table shows the measured values and passed/failed sample counts. Empty buckets are Unknown, and lines stop across missing observations. Manual tests, cancelled and interrupted calls, gaps and in-flight calls do not produce points; use the availability dashboard for coverage and those outcomes.
The charts use all retained observations, independently of the latest 100 results list. Separate schedules remain separate series, even for the same endpoint. A schedule keeps its history across revisions and pauses. Removed targets appear while they have scheduled history in the selected window. Selection persists when you change the window on this page.
Operate the runner
The default concurrency limit is four, with one active call per check and serialized MCP calls per server. Missed ticks become gaps; no catch-up burst occurs. Previously enabled schedules revalidate on restart. Use --pause-on-start after restoring a backup.
termorq-cli web-check --workspace ~/source/acme-apis --env Staging --pause-on-start
termorq-cli web-check --data-dir /absolute/path/to/app-data --state-dir /absolute/path/to/check-state --storage-mib 2048
Default storage is <application-data>/web-check/<source-environment-scope>/web-check.db. macOS uses ~/Library/Application Support/com.garrardkitchen.ai-terminal; Windows uses %APPDATA%/com.garrardkitchen.ai-terminal; Linux uses $XDG_DATA_HOME/com.garrardkitchen.ai-terminal or ~/.local/share/com.garrardkitchen.ai-terminal. Startup prints exact paths. The database stays outside team exports and desktop encrypted backups.
Retention is seven days and the default database/journal budget is 1 GiB. Storage failure stops scheduling. A synthetic 10,000-row measurement extrapolated to about 92 MiB per check for seven days at five-second intervals. One hundred such checks exceed the default budget; choose fewer checks, longer intervals or a measured larger budget.
Stop cleanly before copying the entire scope folder for backup. Preserve database and journal files together after an unclean stop. Restore while stopped, preserve user-only permissions, start with --pause-on-start, review credentials and test before enabling checks.
Interactive API OAuth is rejected. Use an unattended connection. Monitoring verifies TLS using system roots and configured custom CA settings; redirects are disabled. The runner binds only to loopback, validates Host/Origin and authenticates browser access. An offline browser shows potentially stale results and disables management.
The dedicated README-WEBCHECK.md in the repository covers all CLI options, prerequisites, backup/restore, supported authentication, limits, troubleshooting and integration-test commands.